Getting Started with ESP32 IDF and ByteBeam Part 4 - Cloud Logging and Remote Debugging
Learn to publish and monitor logs on Bytebeam
In Earlier parts of this getting started guide, we understood some basic concepts of bytebeam cloud that can be very helpful for your IoT application.
- Earlier in Part 1 and Part 2, we understood some basic concepts of bytebeam cloud that can be very helpful for your IoT application. In Part 1 we discussed device management and data visualization.
- In Part 2 we performed over the air firmware update on our ESP32 device.
- In Part 3 we created an action on Bytebeam cloud to toggle the led on ESP32
Within this article, we will be focusing on remote logging using the Bytebeam cloud.
why remote logging is important in IoT devices
Remote logging is important in IoT devices for several reasons:
- Debugging and Troubleshooting: Remote logging allows developers and support teams to remotely access log files generated by IoT devices. These log files can provide valuable information for debugging and troubleshooting issues in the device's firmware or software, even when the device is located remotely.
- Performance Monitoring: Remote logging can also help monitor the performance of IoT devices. By analyzing log data, developers can identify patterns that may indicate performance issues, such as slow response times or frequent errors. This can help improve the overall performance and reliability of the IoT device.
- Security Monitoring: Remote logging can also help monitor the security of IoT devices. By analyzing log data, developers can identify potential security breaches and quickly take action to prevent further damage. This is especially important for IoT devices that may be deployed in unsecured locations.
logging and remote debugging using Bytebeam
Bytebeam offers this cool feature to monitor device logs using very simple steps. Next, we will guide you through the procedure to enable logging functionality and monitor device logs using the bytebeam cloud.
So let's get started.
Hardware Requirements
- ESP 32 dev module
Configuring bytebeam logs in ESP32
- Navigate to esp-bytebeam-sdk -> examples -> cloud_logging -> main -> app_main.c.
- First, declare the bytebeam_client_t variable. It is a structure containing host, port, certificates, project id and device id information.
static bytebeam_client_t bytebeam_client;- Next, Define TAG for your logs.
static const char *TAG = "BYTEBEAM_CLOUD_LOGGING_EXAMPLE";
- In app_main(), call syncTimeFromNtp() to sync time with NTP.
static void sync_time_from_ntp(void)
{
    time_t now = 0;
    struct tm timeinfo = {0};
    int retry = 0;
    const int retry_count = 10;

    initialize_sntp();

    // wait for time to be set
    while (sntp_get_sync_status() == SNTP_SYNC_STATUS_RESET && ++retry < retry_count)
    {
        ESP_LOGI(TAG, "Waiting for system time to be set... (%d/%d)", retry, retry_count);
        vTaskDelay(2000 / portTICK_PERIOD_MS);
    }

    time(&now);
    localtime_r(&now, &timeinfo);
}
static void initialize_sntp(void)
{
    ESP_LOGI(TAG, "Initializing SNTP");

    sntp_setoperatingmode(SNTP_OPMODE_POLL);
    sntp_setservername(0, "pool.ntp.org");
    sntp_set_time_sync_notification_cb(time_sync_notification_cb);

#ifdef CONFIG_SNTP_TIME_SYNC_METHOD_SMOOTH
    sntp_set_sync_mode(SNTP_SYNC_MODE_SMOOTH);
#endif

    sntp_init();
}
- call bytebeam_init to initialise and then bytebeam_start to start the Bytebeam client.
bytebeam_init(&bytebeam_client);
bytebeam_start(&bytebeam_client);
- Bytebeam provides logging APIs to send logs to the cloud. bytebeam_is_cloud_logging_enabled() API checks whether the logging functionality is enabled or not.
bool isloggingEnabled = bytebeam_is_cloud_logging_enabled();- bytebeam_enable_cloud_logging() API enables cloud logging feature.
bytebeam_enable_cloud_logging() //enables cloud logging- bytebeam_disable_cloud_logging() API disables the cloud logging feature
bytebeam_disable_cloud_logging() //disables cloud logging- bytebeam_log_level_get() API gets the current log level
bytebeam_log_level_t bytebeam_log_level_get() //get the bytebeam log level- bytebeam_log_level_set() API sets the log level.
- Each log message can be associated with the following log level
- BYTEBEAM_LOG_LEVEL_NONE
- BYTEBEAM_LOG_LEVEL_ERROR
- BYTEBEAM_LOG_LEVEL_WARN
- BYTEBEAM_LOG_LEVEL_INFO
- BYTEBEAM_LOG_LEVEL_DEBUG
- BYTEBEAM_LOG_LEVEL_VERBOSE
- Default log level is set to INFO. To set the log level to let's say DEBUG, call bytebeam_log_level_set(BYTEBEAM_LOG_LEVEL_DEBUG)
bytebeam_log_level_set(BYTEBEAM_LOG_LEVEL_ERROR) //log level set to error- We can publish logs to Bytebeam cloud using following API
BYTEBEAM_LOGE(TAG, "I am %s Log", "Error"); //write error logs to cloud
BYTEBEAM_LOGW(TAG, "I am %s Log", "Warn");  //write warn logs to cloud
BYTEBEAM_LOGI(TAG, "I am %s Log", "Info");  //write info logs to cloud
BYTEBEAM_LOGD(TAG, "I am %s Log", "Debug"); //write debug logs to cloud BYTEBEAM_LOGV(TAG, "I am %s Log", "Verbose"); //write verbose logs to cloud - Now navigate back to cloud_logging directory and flash your example
Idf.py -p PORT flash monitorIn the next section, we will configure the logs stream and will monitor logs on the Bytebeam dashboard.

Configuring Log Stream on Bytebeam cloud
- Next, we need to configure the stream where we will define our data keys and their data types. For this go to Admin in the top right corner and select Streams. You will find the Table Name, Column Name, and Column Type in Streams. Add your data keys in Column Name and respective data types in Column Type. Here, Add tag, level and message keys with string as their respective data types and logs as your Table Name. In this example we are using the following data keys:
- tag: TAG for your logs.
- level: Log Level
- message: log message.

Creating a Dashboard
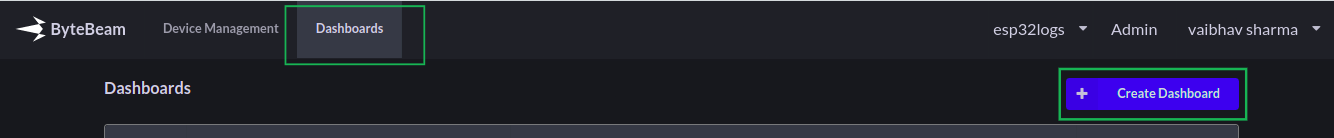
Now let’s create a dashboard to visualise our logs. Click on Dashboards in the bytebeam console. And then click on Create Dashboard.
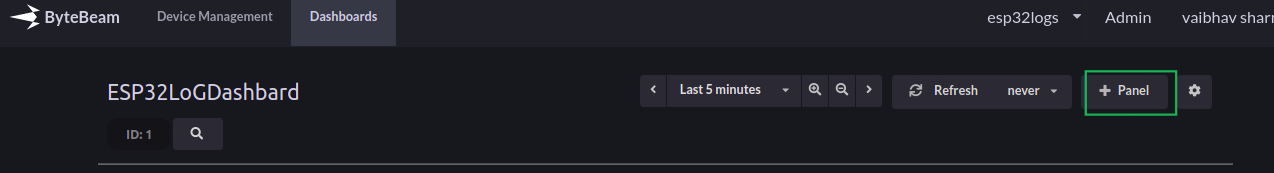
- Add a title to your dashboard like we have given the title ESP32logDashboard. Select Device Dashboard from the Dashboard Type dropdown and leave other columns as defaults. Then hit Submit.

- Now Navigate to the Dashboards tab. Click on the dashboard title and then click on the Select button to select the device.
- Click on the Panel button to add visualizations.
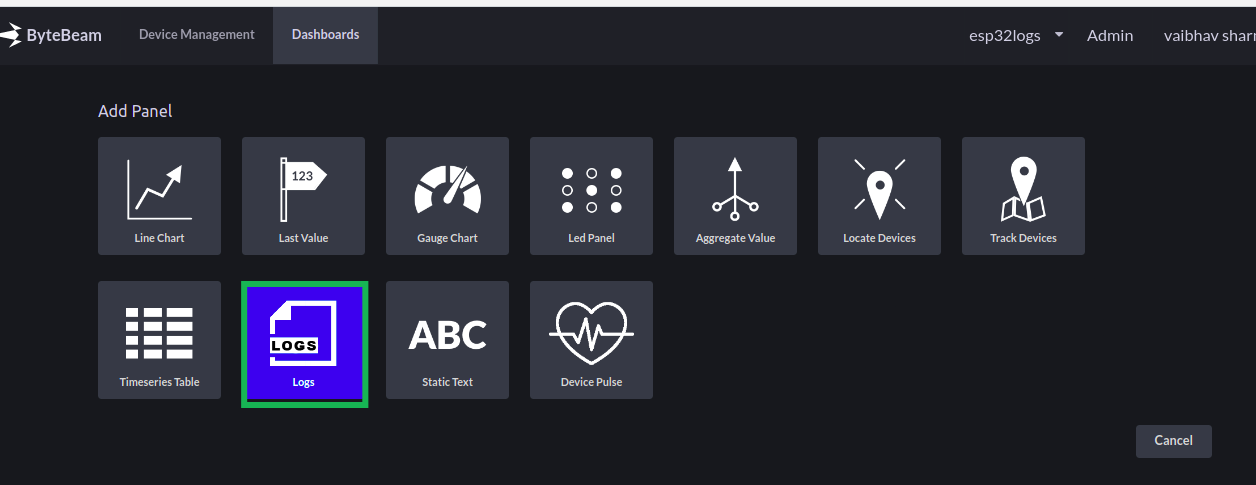
- Select from different panels available. Like we are choosing Logs.
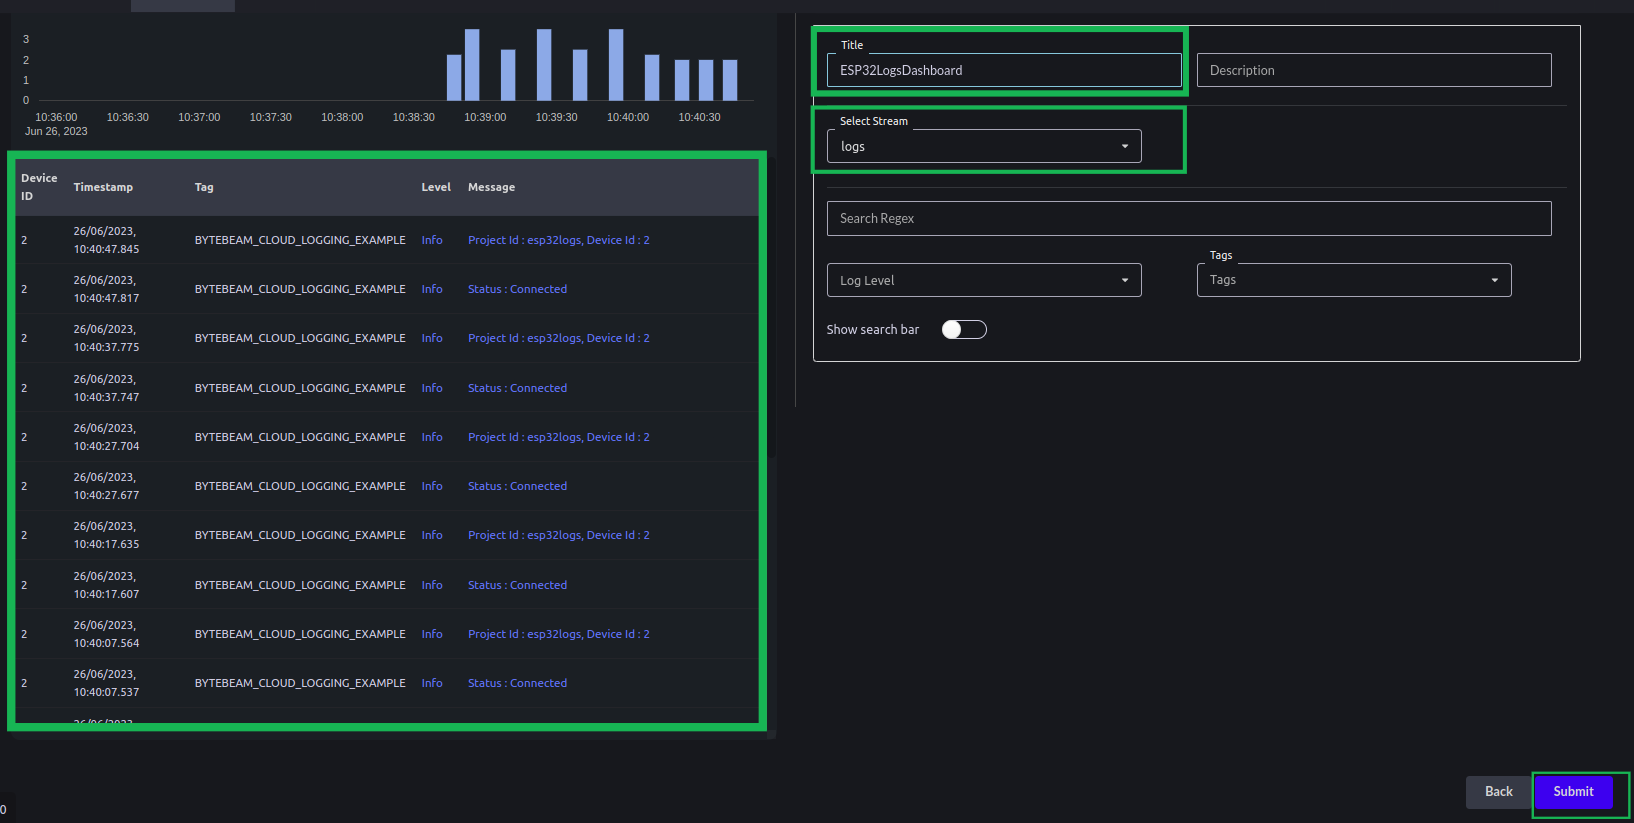
- Give a name to your panel in the Title. select the table (logs in our case) from the Table drop-down. now your log table will look like this. Click on the Show search bar toggle button to show search bar. and Hit Submit.
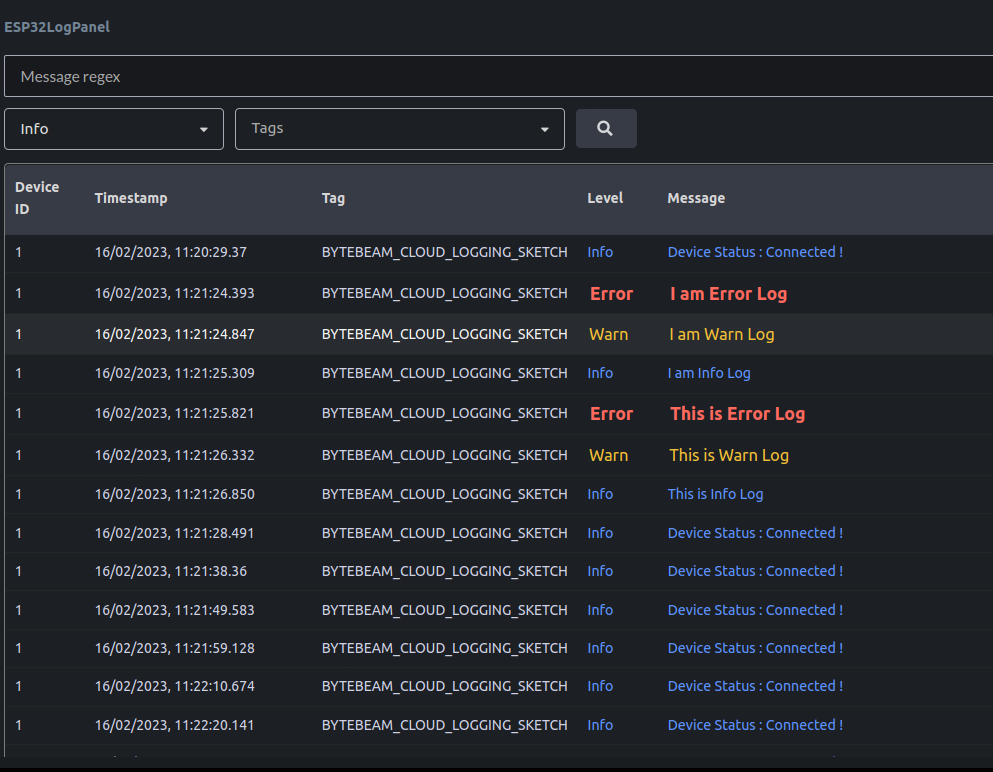
- Now go back to your dashboard and click on the Save icon to save your changes. Here you will find the log panel. In the log panel, you can monitor your logs for your respective device id.

Conclusion
I hope you find this tutorial useful. Check out our other guides on Data visualization, OTA, and Handling actions. In Part 5 of this multi-part series, we will be exploring the update configuration option provided by ByteBeam.
I hope you gained valuable insights from this comparison summary. As we continue to come up with more interesting tutorials and maker content, we invite you to explore Bytebeam further and see how our platform can empower your projects.


