Getting Started with Linux and ByteBeam Part 1 - Data Visualization
Learn about device management and visualising device data using Bytebeam cloud and Raspberry Pi
In Part 1 of this tutorial series, we will cover the following topics:
- Setting up the Bytebeam cloud console: We will go through creating an account and setting up a new project on the Bytebeam cloud console.
- Setting up uplink on Linux device: We will download and install bytebeam image on Raspberry Pi. Next, We will set up Bytebeam's Linux agent uplink on the device.
- Provisioning Linux device: We will provision linux device using provisioning JSON.
- Connecting linux device to the Bytebeam platform: We will learn how to connect a Raspberry Pi to the Bytebeam platform and how to send data from the device to the cloud.
- Data visualization on the Bytebeam cloud console: We will explore the data visualization tools by Bytebeam and learn how to view and analyze data from the connected device in real time.
In this tutorial, We will use Raspberry Pi as a Linux device to compile our example. We will create a simple application to monitor the on-chip temperature of Raspberry Pi.
What to expect from this guide: By the end of this tutorial, you should have a good understanding of how to use the uplink and how to effectively manage and visualize data from Raspberry Pi using the Bytebeam platform.
Hardware Requirements
- Raspberry Pi 3B+ or Raspberry Pi 4
- 16 GB SD card
Getting Started with ByteBeam Cloud
Firstly, you need to create an account on Bytebeam Cloud (cloud.bytebeam.io). In case you already have an account with Bytebeam Cloud then you can proceed further with this guide or else follow Getting started with Bytebeam cloud.
Creating a new project
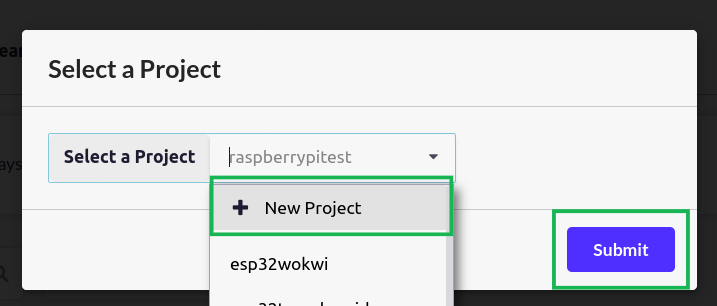
- Login to your Bytebeam account to access the cloud console.
- Now click on New Project.
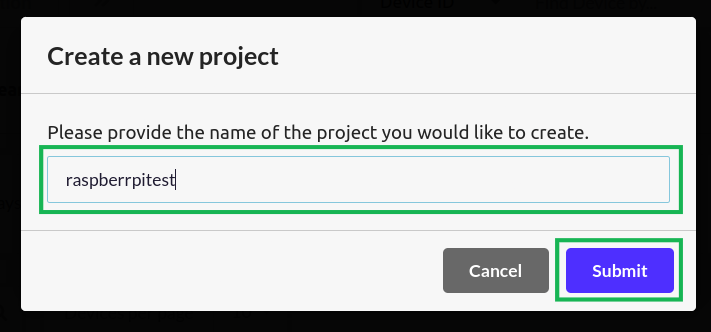
- Next, provide a name for your project and hit submit. I have given it the name “raspberrypitest”
Setting up uplink on Linux device
- Before moving to uplink, First set up your Raspberry Pi. Follow Linux Device Setup docs to install the new bytebeam image to Raspberry Pi.
- Once the Pi is up run the below one-time setup script. This script installs Bytebeam's Linux agent uplink as well as scripts required for over-the-air updates
sudo curl --proto '=https' --tlsv1.2 -sSf https://raw.githubusercontent.com/bytebeamio/uplink/main/scripts/one_time_setup.sh | sudo bashProvisioning Linux device
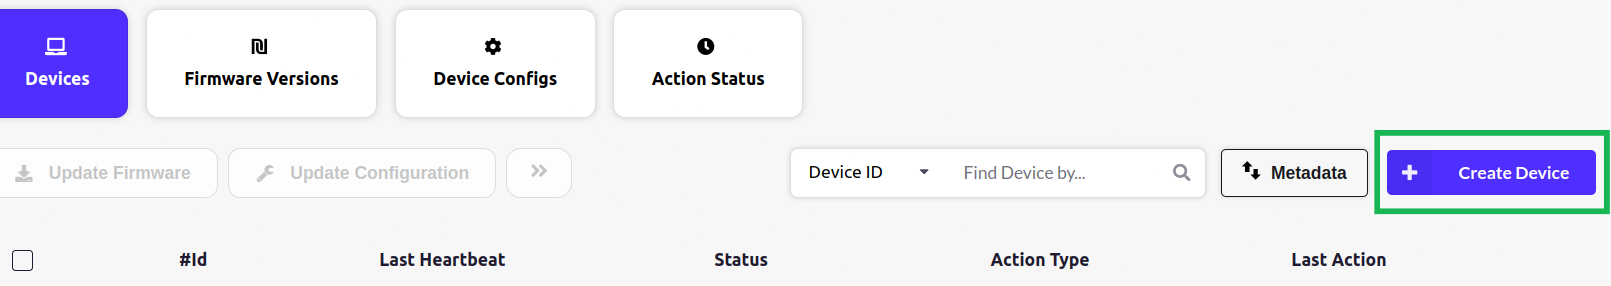
Click on Create Device button to provision a new device to Bytebeam cloud. And hit Submit.
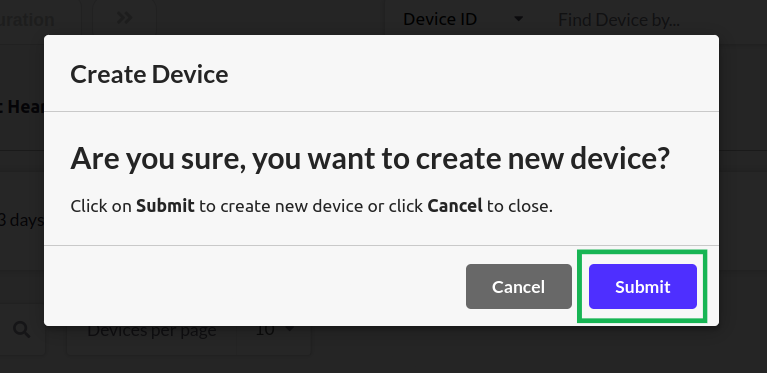
- As you hit submit in the prompt. A new JSON file will be downloaded which contains the authentication certificate, broker, device_id, and project id. The JSON will look like this.
{
 "project_id": "****",
 "broker": "******",
 "port": 8883,
 "device_id": "**",
 "authentication": {
      "ca_certificate":*"*********",
      "device_certificate": "**********",
      "device_private_key": "***********"
      }
}- Rename the downloaded JSON file to device.json and place it in the download partition (/mnt/download) of the raspberry pi. If you are connecting to the device via ssh you can use the below scp command. First, provide permission to the /mnt/download partition using chmod command.
chmod 777 /mnt/download- And, then use scp command
scp /home/bytebeam/Downloads/device.json user@<IP address of device>:/mnt/downloadRunning Uplink
- no your device, Enter the following systemctl commands to start and enable the uplink service at boot.
sudo systemctl start uplink
sudo systemctl enable uplink- To verify that the uplink is up and running, check the status in systemd, using the following command.
sudo systemctl status uplink- You should see the status as "active".

Connecting Linux device to the Bytebeam platform
Within this section, we will go through the steps involved in establishing a connection between a Raspberry Pi and the Bytebeam cloud platform. Firstly, We will be configuring the stream. Subsequently, we will execute a Python script to transmit data to the Bytebeam cloud platform.
Configuring a Stream on Bytebeam cloud console
- First, let us create a stream called temperature on the Bytebeam cloud. Go to Bytebeam Cloud. Now, click on your username in the top right corner and navigate to the “Settings” section.

- Next, select Streams and Click on "Create Stream".

- Now, enter the stream name and column name. In this example, we have chosen the data type of temperature as Float64. Click on the "Submit" button.

- The temperature stream should be visible under the "Streams" section.

Configuration on the device side
- On Raspberry Pi create a new Python script. and use the following code sample.
import socket
import json
import time
from gpiozero import CPUTemperature

s = socket.socket(socket.AF_INET, socket.SOCK_STREAM)
s.connect(("localhost", 5050))


# Constructs a payload and sends it over TCP to uplink
def send_data(s, payload):
    send = json.dumps(payload) + "\n"
    s.sendall(bytes(send, encoding="utf-8"))


# Send the temperature data
def send_temperature_stream(s, sequence):
    cpu_temperature = CPUTemperature().temperature
    timestamp = int(time.time() * 1000)
    payload = {
        "stream": "temperature",
        "sequence": sequence,
        "timestamp": timestamp,
        "temp": cpu_temperature,
    }
    print(payload)
    send_data(s, payload)


print("Starting Uplink Bridge App")

sequence = 1
while True:
    time.sleep(5)
    send_temperature_stream(s, sequence)
    sequence += 1
- No run the Python script. The temperature data should now be visible on the cloud. Head over to Bytebeam Cloud and go to Device Management. Now click on the device and Select Show Streams.

- Select temperature stream.

- The temperature data should be visible on the cloud now.

Creating a Dashboard
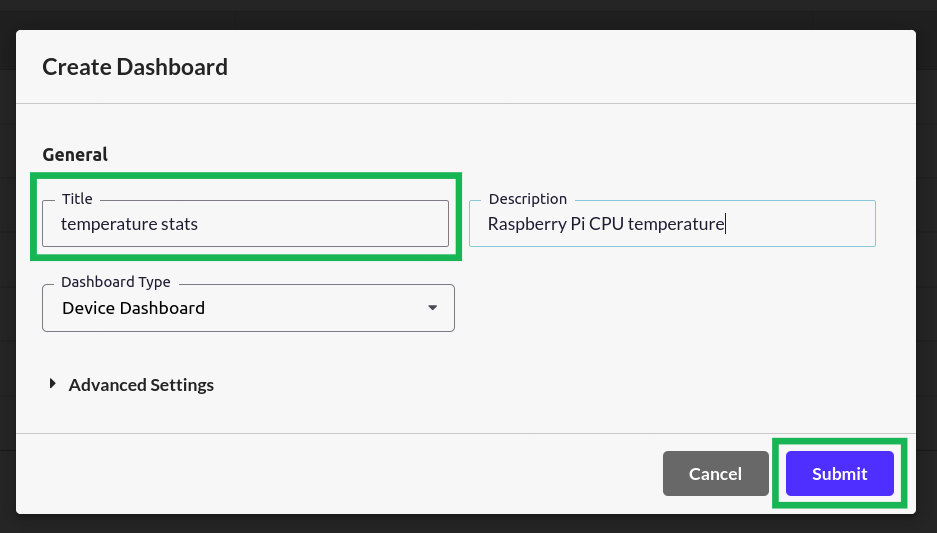
- Now let’s create a dashboard to visualise our data. Click on Dashboards in the bytebeam console. And then click on Create Dashboard.

- Add a title to your dashboard like we have given the title temperatureStats. and leave other columns as defaults.
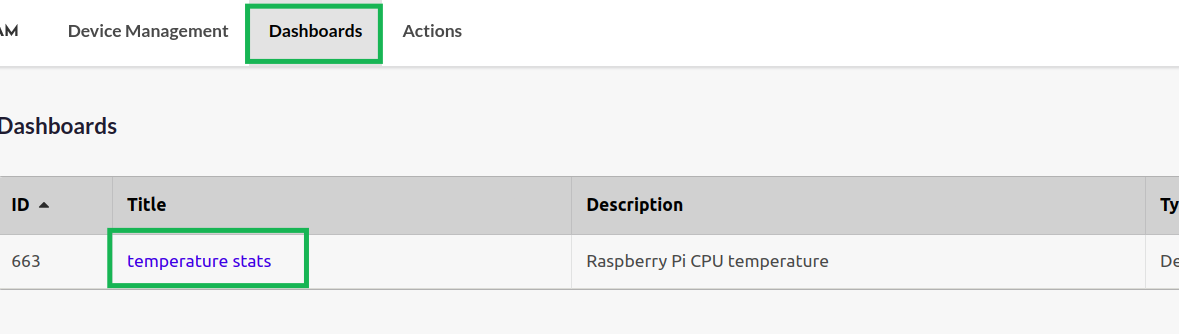
- Now Navigate to the Dashboards tab. And click on the dashboard title.
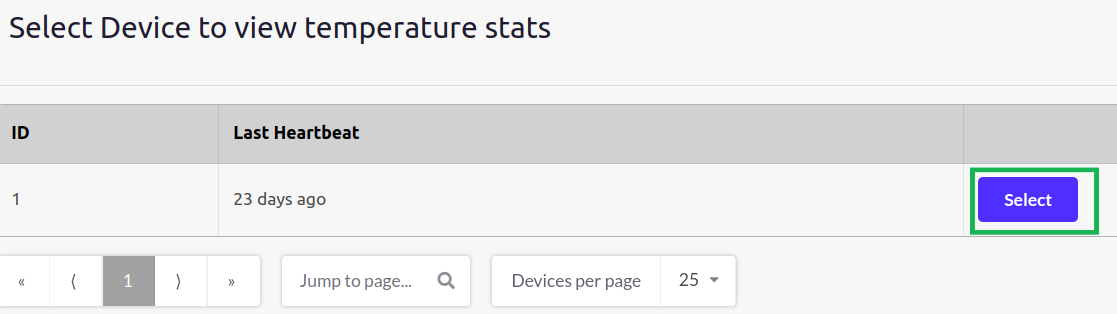
- On the next screen. Click on Select to choose the device
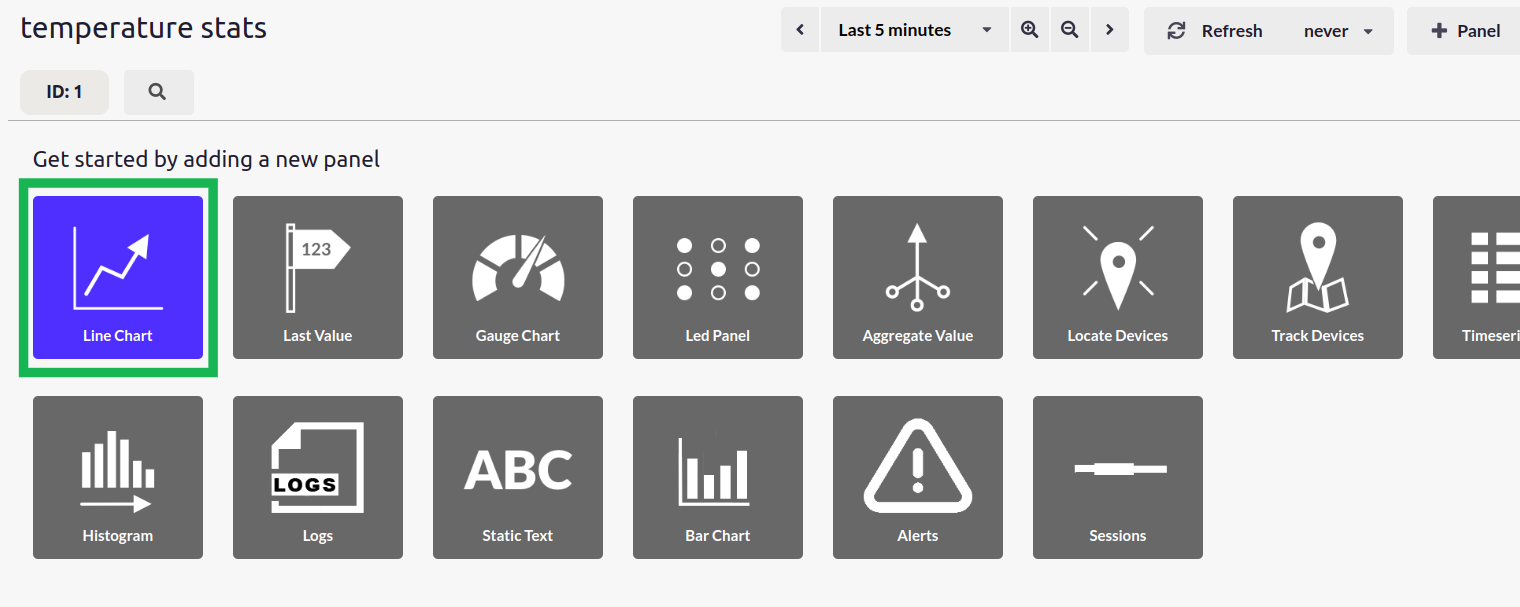
- Choose a panel of your choice to create visualization. We have chosen a Line chart for this example
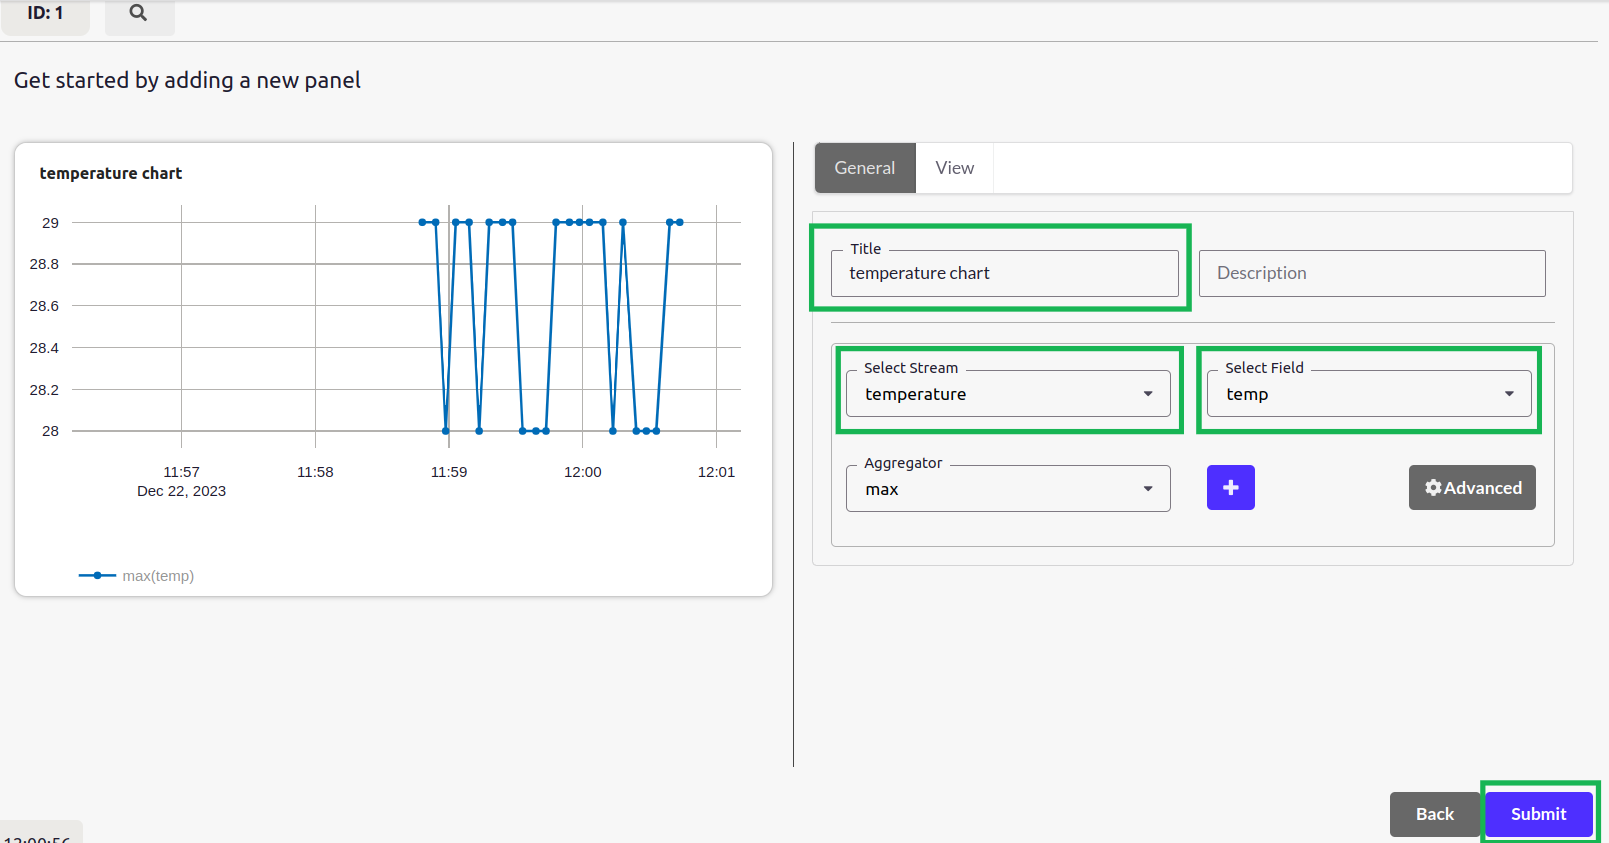
- Give a name to your panel in the Title. select the table (temperature in our case) from the Table drop-down. select a column (temp in our case) from the Column dropdown. and select max from the third drop-down. now your graph will look like this.
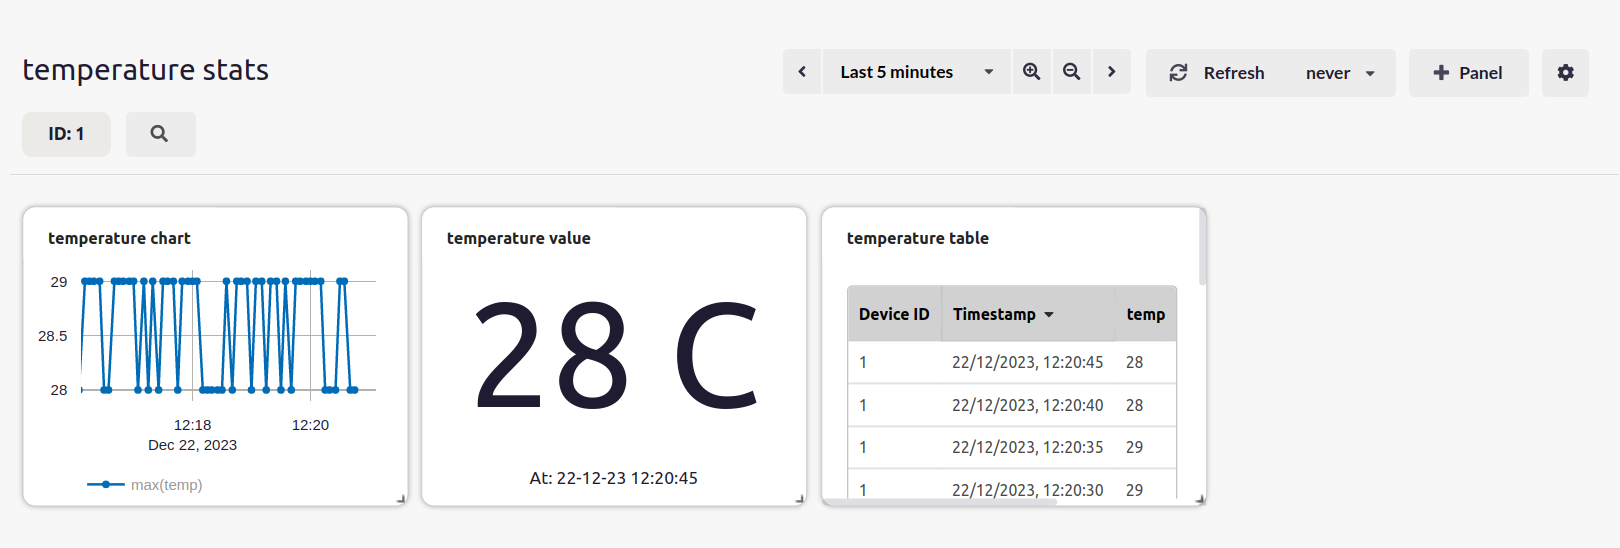
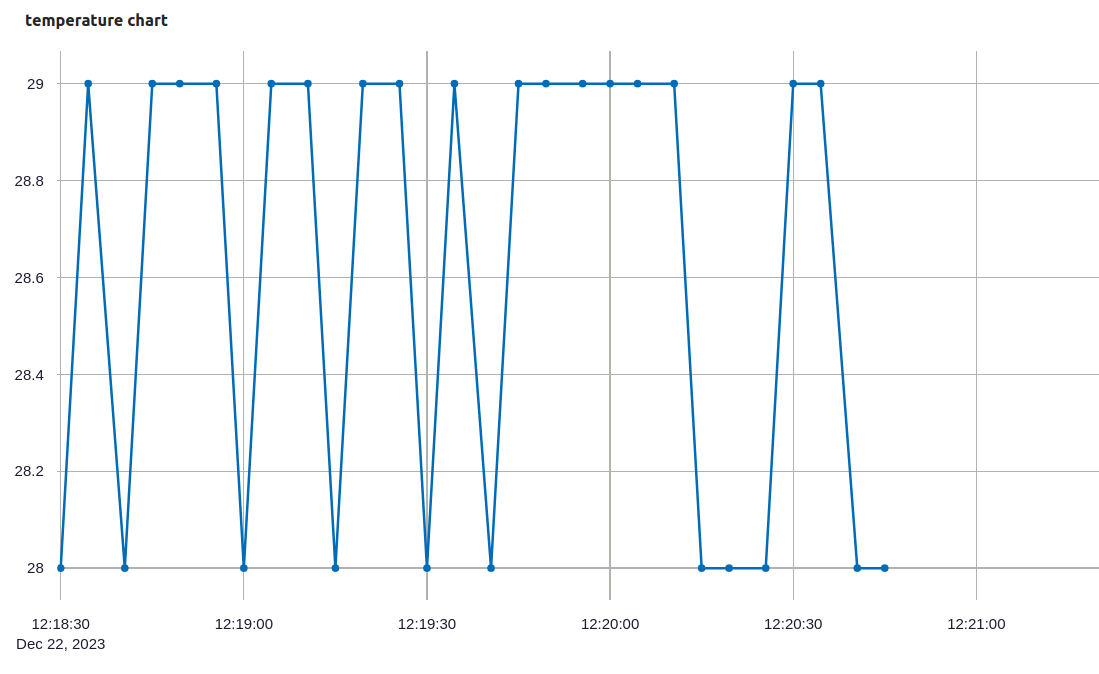
- Like this, you can create multiple visualizations at a user-defined refresh period for your dashboard. We are getting values every second from the device and we are updating the dashboard every 5s.
Conclusion
I hope you find this tutorial useful. We will come up with other interesting features offered by ByteBeam like OTA, remote debugging, actions and notifications, and more. In Part 2 of this multi-part series, we will be exploring the remote OTA option provided by ByteBeam for linux. Stay in touch to get information on many other interesting IoT projects.


