Getting Started with ESP32 Arduino and Bytebeam Part 1 - Data Visualization
Learn about device management and visualising device data using Bytebeam cloud and Arduino IDE
In Part 1 of this tutorial series on the Bytebeam SDK for Arduino, we will cover the following topics:
- Setting up the Bytebeam cloud console: We will go through creating an account and setting up a new project on the Bytebeam cloud console.
- Setting up Bytebeam Arduino SDK: We will set up Arduino SDK and create a simple touch application using ESP32.
- Provisioning ESP32: We will provision ESP32 using provisioning JSON.
- Connecting an ESP32 to the Bytebeam platform: We will learn how to connect an ESP32 to the Bytebeam platform and how to send data from the device to the cloud.
- Data visualization on the Bytebeam cloud console: We will explore the data visualization tools by Bytebeam and learn how to view and analyze data from the connected Arduino device in real-time.
In this tutorial, We will use ESP32 to compile our example. We will create a simple application to monitor the on-chip temperature of ESP32 SoC. ESP32 comes with an inbuilt temperature sensor which can sense the temperature of ESP32 SoC.
By the end of this tutorial series, you should have a good understanding of how to use the Bytebeam SDK for Arduino and how to effectively manage and visualize data from IoT devices using the Bytebeam platform.
Hardware Requirements
Software Requirements
We recommend installing the latest version of all the tools and IDE.
Getting Started with ByteBeam cloud
Firstly, you need to create an account on Bytebeam Cloud (cloud.bytebeam.io). In case you already have an account with Bytebeam Cloud then you can proceed further with this guide or else follow Getting started with Bytebeam cloud.
Creating a new project
- Login to your Bytebeam account to access the cloud console.
- Now create a New Project and give it a name. I have given it the name “esp32app”
- In the next screen, you will be asked to select the project. Select the newly created project and proceed further

Provisioning a new device
Click on Create Device button to provision a new device to Bytebeam cloud. And hit Submit.


- As you hit submit in the prompt. A new JSON file will be downloaded which contains the authentication certificate, broker, device_id, and project id. You need to save this file in the ESP file system. We will talk about this in a later section. The JSON will look like this.
{
 "project_id": "****",
 "broker": "******",
 "port": 8883,
 "device_id": "**",
 "authentication": {
      "ca_certificate":*"*********",
      "device_certificate": "**********",
      "device_private_key": "***********"
      }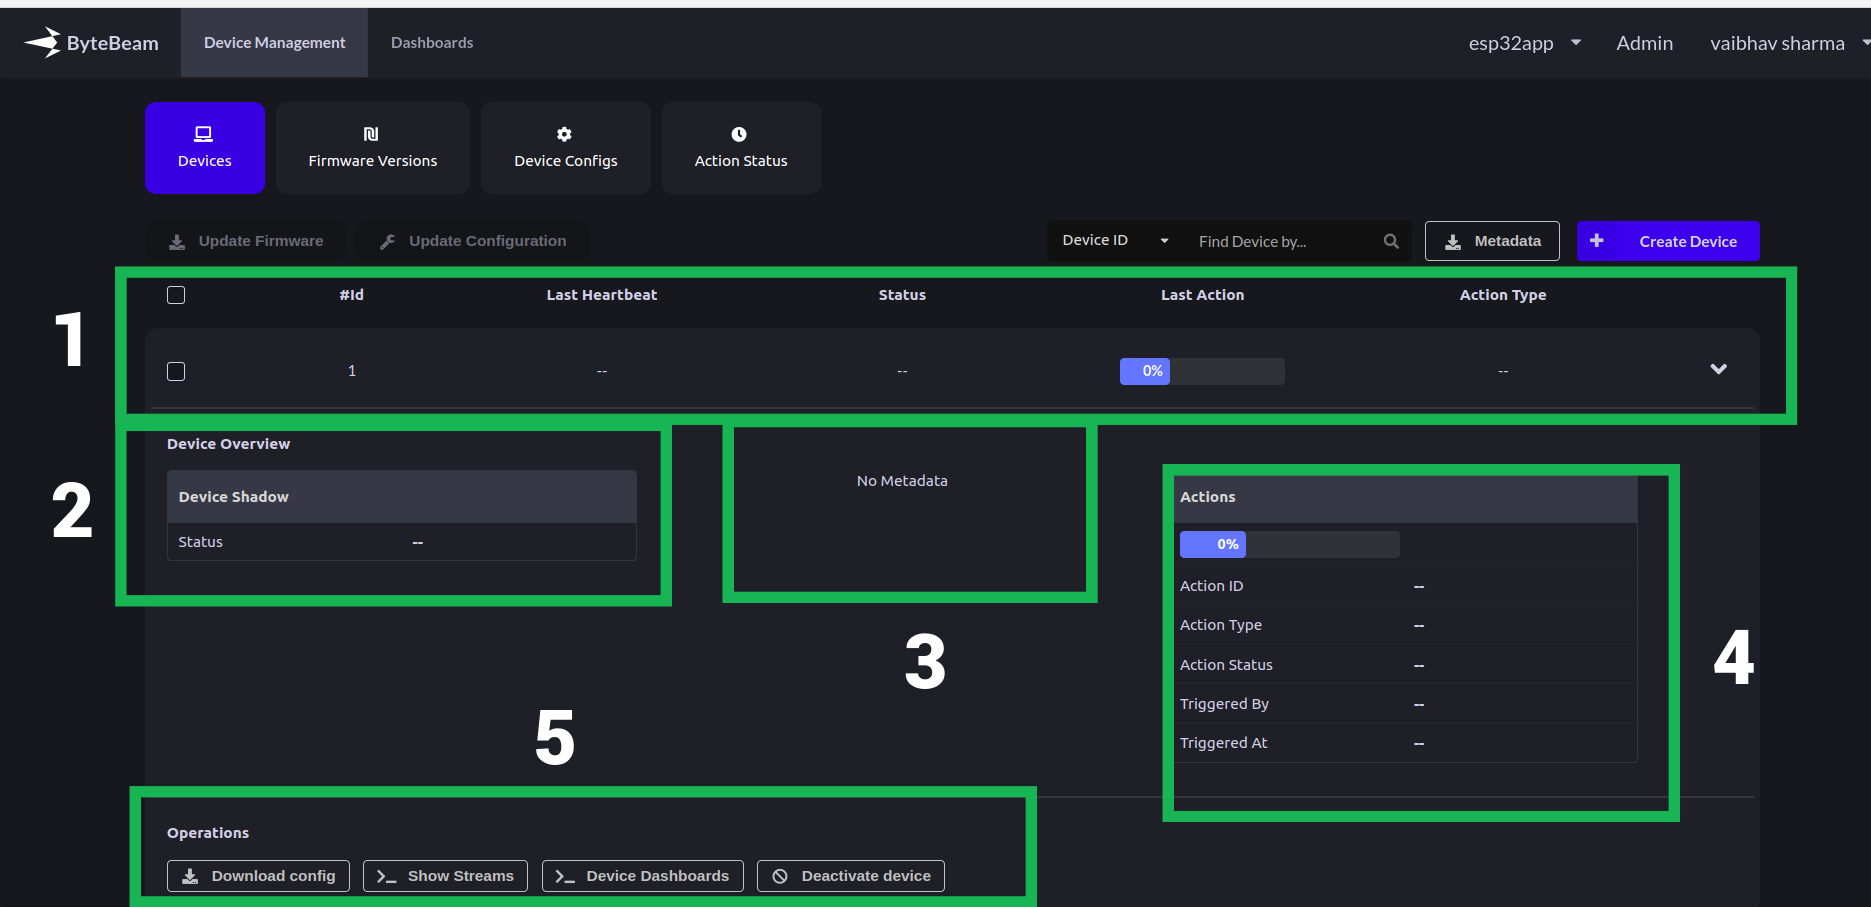
}- Now you can find the newly created device in the console. The provisioned device will have the following columns (refer to below image)
- Device Status Panel: Contains the latest status information received from the device
- id: This column shows the device id of the provisioned device.
- Last Heartbeat: last online status of the device.
- Device Status: status object from device shadow received from the device
- Last Action: This column gives us information about the last action id, last action status, its progress and type.
- Action Type: Type of action like update firmware, update configuration or any other custom action.
- Device Shadow Panel: Contains device shadow information received from the device
- Metadata Panel: Contains information about the device Metadata.
- Action Panel: Contains information about action triggered on the device from the cloud console. It contains the following columns.
- Action Id: Id of the triggered action.
- Action Type: Type of action like custom action, update firmware action or update configuration action.
- Action Status: Lifecycle of action.
- Triggered By: User information.
- Triggered At: At what time triggered?
- Operations Panel:
- Download config: Download device configuration JSON from here.
- Device Dashboards: Go to the dashboard of the respective device from here.
- Deactivate Device: Deactivate or hides the current device.
- Device Status Panel: Contains the latest status information received from the device
Setting up ByteBeam SDK for Arduino
ByteBeam provides an SDK for Arduino to connect to the ByteBeam cloud platform. This guide assumes that you have a fair understanding of Arduino and that you had already set up Arduino on your machine. In case you haven’t done this you should follow Arduino-esp32 Getting Started Guide before going further.
Installing Bytebeam SDK library for Arduino from Arduino Library Manager
You can download Bytebeam SDK for Arduino from the Arduino Library manager for that
- Open Arduino IDE and navigate to Sketch-> Include Library -> Manage Libraries
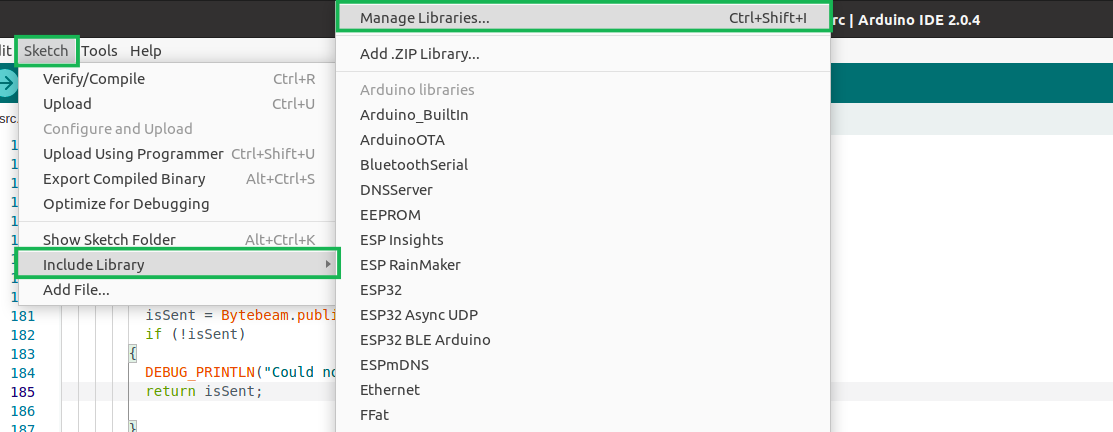
- In the Library Manager Search for BytebeamArduino. Then click on Install to install the libraries.
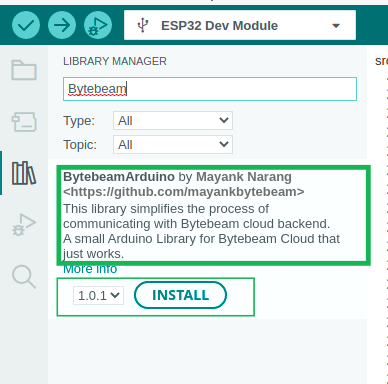
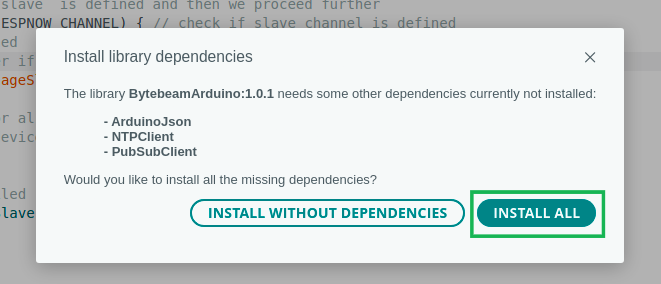
- In the next prompt click on Install All to install all the associated libraries.
Provision ESP32 with device config data
Earlier in this guide, we had provisioned a new device in the bytebeam cloud console and downloaded a JSON file. We need to flash this file to the ESP32 file system called SPIFFS to connect our device to the cloud.
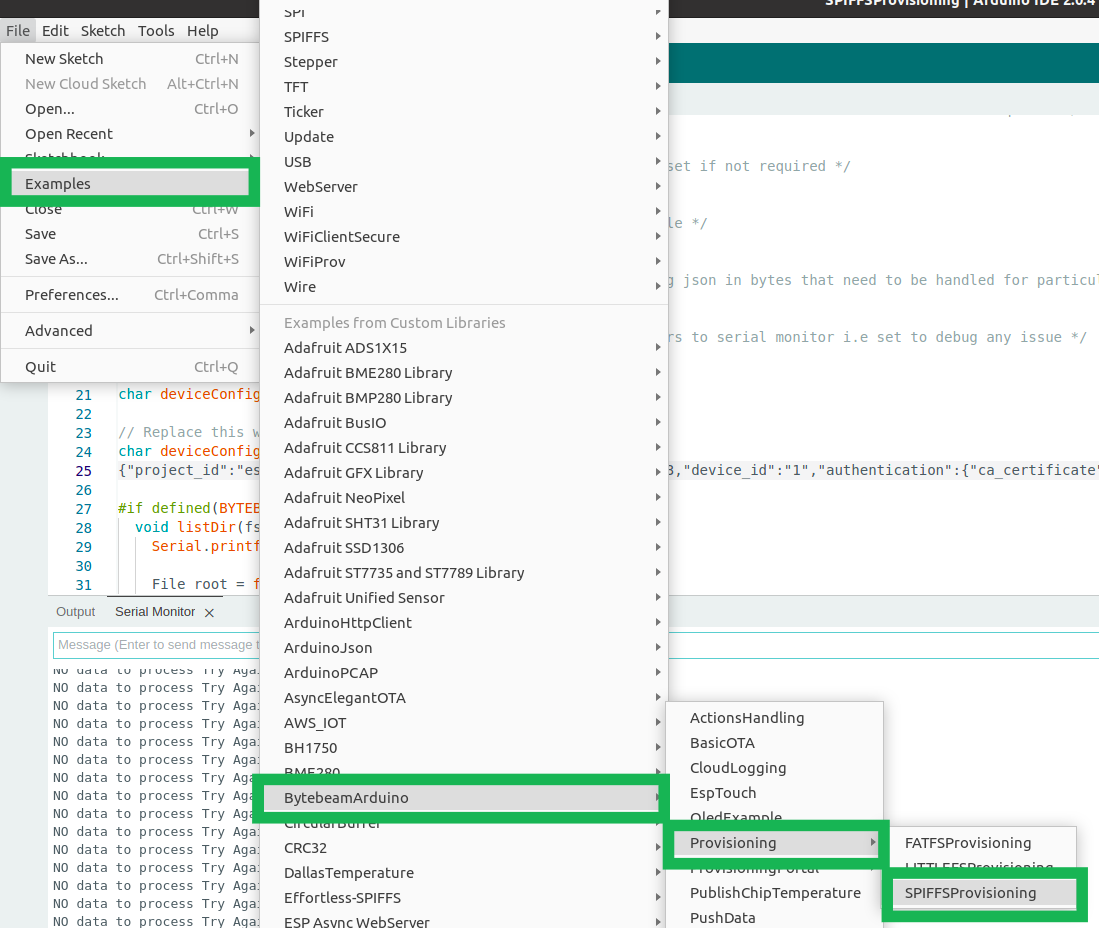
- To provision your ESP32 device, Open Arduino and navigate to File->Examples->BytebeamArduino->Provisioning->SPIFFSProvisioning. For the scope of this guide, we will do SPIFFS provisioning
- Now copy the content of your downloaded JSON and paste it into the code at deviceConfigWriteStr
// Replace this with your device config json in the same format
char deviceConfigWriteStr[DEVICE_CONFIG_STR_LENGTH] = R"(
{
    "project_id": "demo",
    "broker": "cloud.bytebeam.io",
    "port": 8883,
    "device_id": "1",
    "authentication": {
        "ca_certificate": "-----BEGIN CERTIFICATE-----***********************ca certificate*********************************-----END CERTIFICATE-----\n",
        "device_certificate": "-----BEGIN CERTIFICATE-----******************************client certificate*********************-----END CERTIFICATE-----\n",
        "device_private_key": "-----BEGIN RSA PRIVATE KEY-----****************************private key*******************************----END RSA PRIVATE KEY-----\n"
    }
}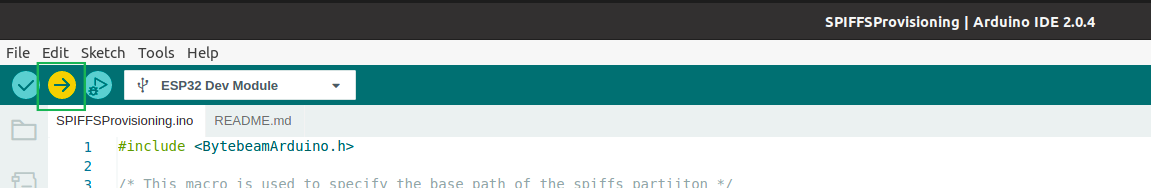
)";- Now upload your example
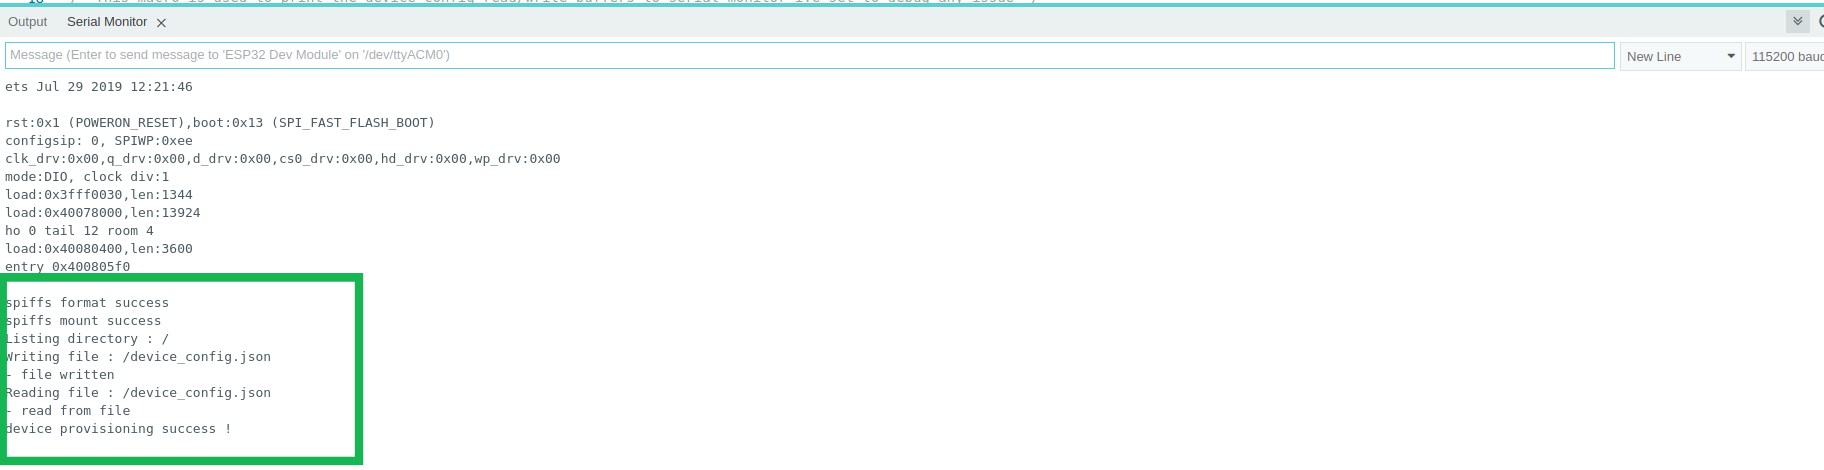
- Next Open Arduino Serial Monitor
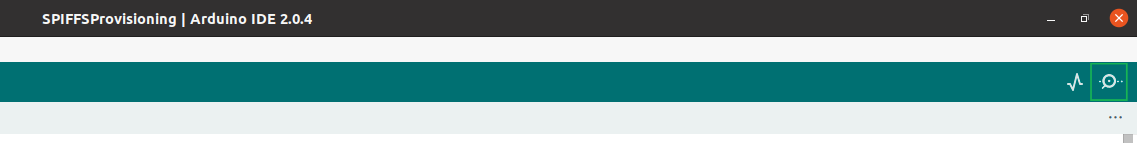
- In Serial monitor you can see that device has been successfully provisioned.
Getting ESP32 on-chip temperature sensor values
Next, we will programme our device with an ESP32 chip temperature example. This is example is included with Bytebeam Arduino SDK.
- Firstly, In Arduino Navigate to File -> Examples -> BytebeamArduino->ESP32->publishChipTemperature.
- To Setup your Wifi credentials navigate to arduino_secrets.h and place your SSID and password here
//
// Place all the sensitive data here
//

#define SECRET_SSID ""
#define SECRET_PASS ""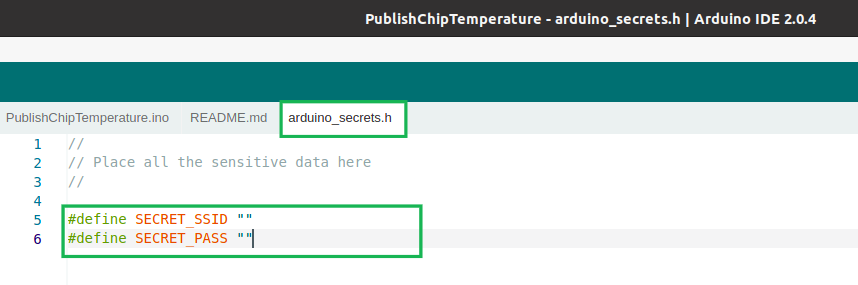
- Next Enter Stream Name.
char tempStream[] = "<StreamName>";- In setup(), call setupWiFi() function to connect to your provided WiFi credentials
void setupWifi() {
  // set the wifi to station mode to connect to a access point
  WiFi.mode(WIFI_STA);
  WiFi.begin(WIFI_SSID , WIFI_PASSWORD);

  Serial.println();
  Serial.print("Connecting to " + String(WIFI_SSID));

  while (WiFi.status() != WL_CONNECTED) {
    Serial.print(".");
    delay(250);
  }

  Serial.print("Connected to " + String(WIFI_SSID) + ", Got IP address : ");
  Serial.println(WiFi.localIP());
}- Next call syncTimeFromNtp() to sync time with NTP.
void syncTimeFromNtp() {
  // sync the time from ntp server
  configTime(gmtOffset_sec, daylightOffset_sec, ntpServer);
  struct tm timeinfo;

  // get the current time
  if(!getLocalTime(&timeinfo)) {
    Serial.println("Failed to obtain time");
    return;
  }

  // log the time info to serial :)
  Serial.println(&timeinfo, "%A, %B %d %Y %H:%M:%S");
  Serial.println();
}
- call Bytebeam.begin() to begin Bytebeam client.
- If you want to specify your provisioning file name stored in SPIFFS, type of provisioning and enable logging then you need to add the following arguments in Bytebeam.begin() function
- deviceConfigFileSystem: bytebeam provides various ways to do your provisioning like FATFS, SPIFFS and LittleFS. For the scope of this guide, we will choose SPIFFS_FILE_SYSTEM
- fileName: provisioning JSON file name "/device_config.json" in our case
- DebugLevel: choose LOG_INFO to enable logging level info
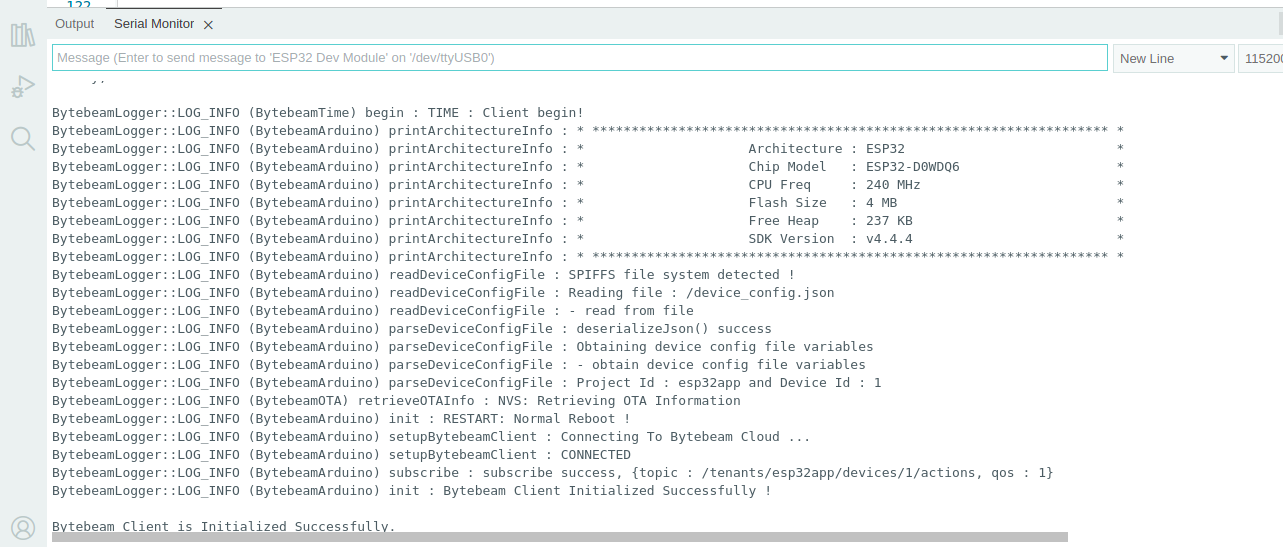
 if(!Bytebeam.begin(SPIFFS_FILE_SYSTEM,"/device_config.json",BytebeamLogger::LOG_INFO)) {
    Serial.println("Bytebeam Client Initialization Failed.");
  } else {
    Serial.println("Bytebeam Client is Initialized Successfully.");
}- In loop(), call Bytebeam.loop() to maintain a connection with MQTT broker.
- Now Upload your example by clicking on the Upload icon.
Configuring a Stream
Next, we need to Create a new stream as configured in our code. For that Click on Admin and then click on Create Stream.
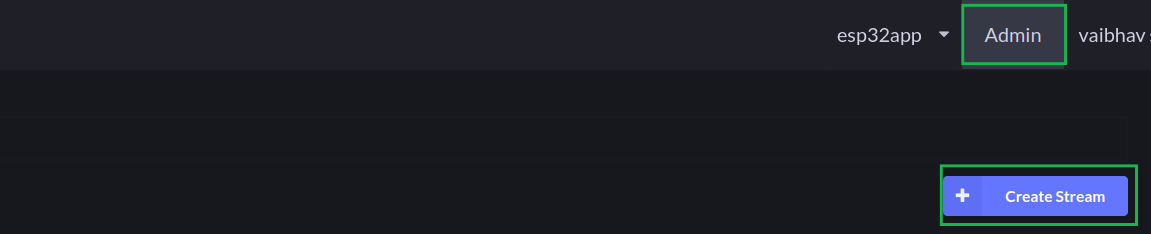
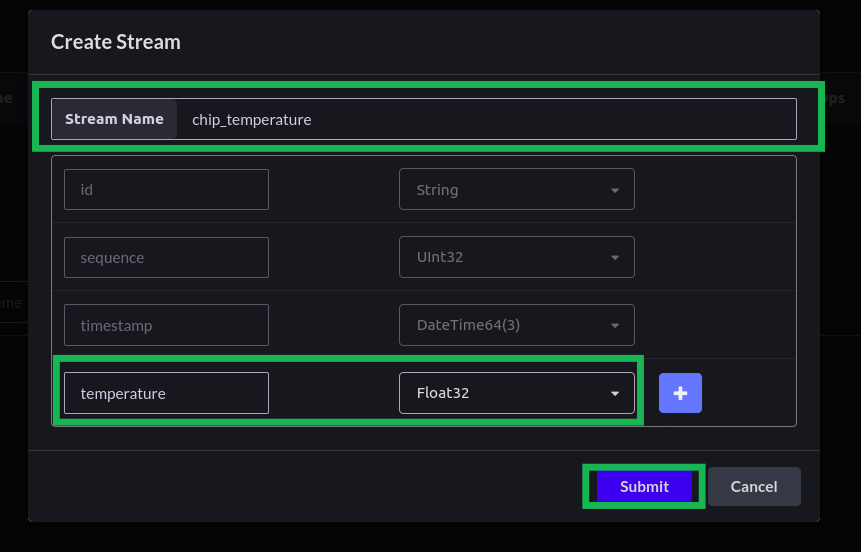
- As you click on Create Stream, A new dialogue will come up here you need to configure your stream.
- First, enter the name of your stream. It is the same as you configure in your Arduino example code. We will give it a name chip_temperature
- You will find the Column Name and Column Type in Streams. Add your data keys in Column Name and respective data types in Column Type. Here I have added the temperature key with Float32. In this example we are using the following data keys:
- id: device id of the device.
- sequence: this is a message counter for all the successful publish.
- timestamp: time of message publish.
- temperature: ESP32 touch sensor values.
- Then click on Submit.
Creating a Dashboard
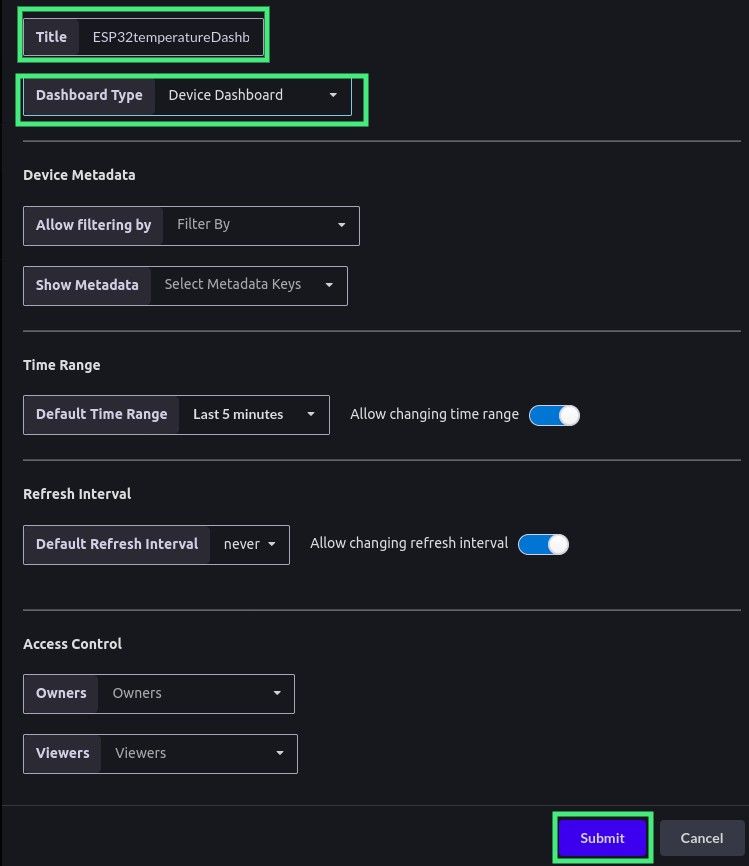
Now let’s create a dashboard to visualise our data. Click on Dashboards in the bytebeam console. And then click on Create Dashboard.

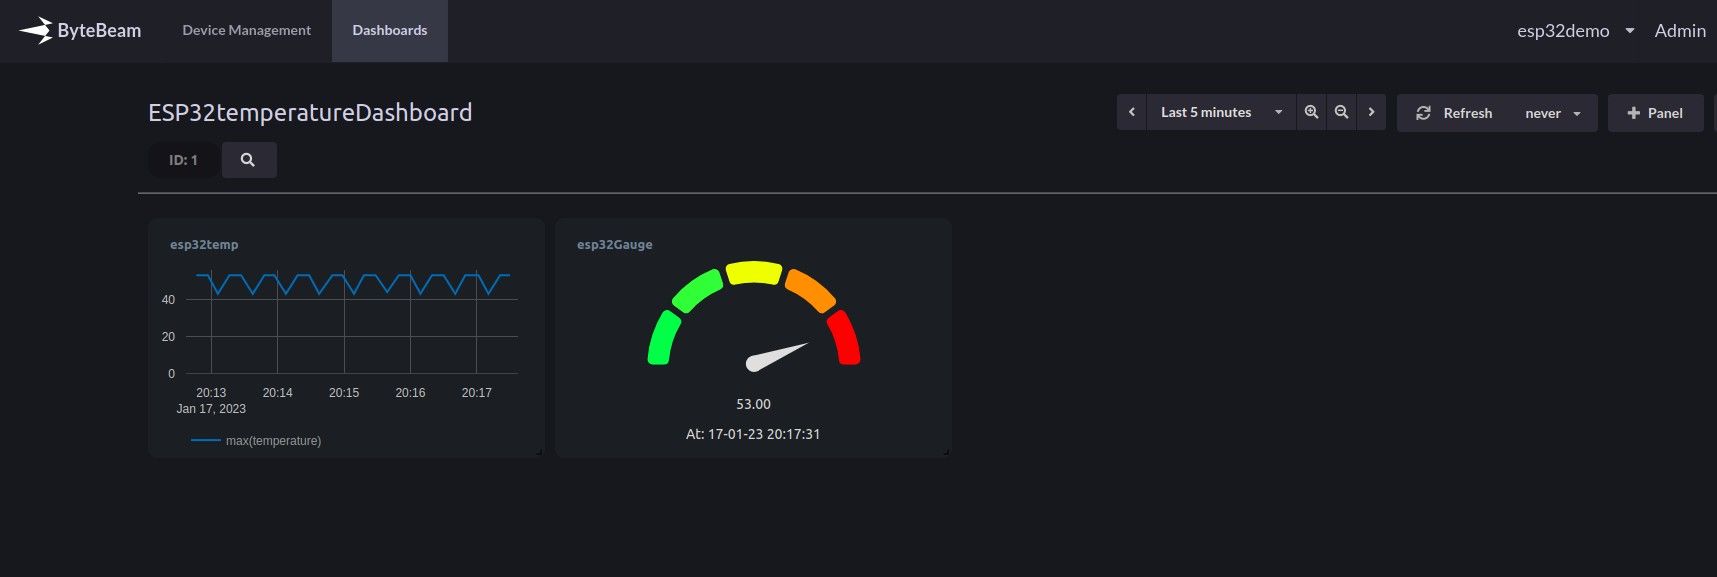
- Add a title to your dashboard like we have given the title ESP32temperatureDashboard. Select Device Dashboard from the Dashboard Type dropdown and leave other columns as defaults.
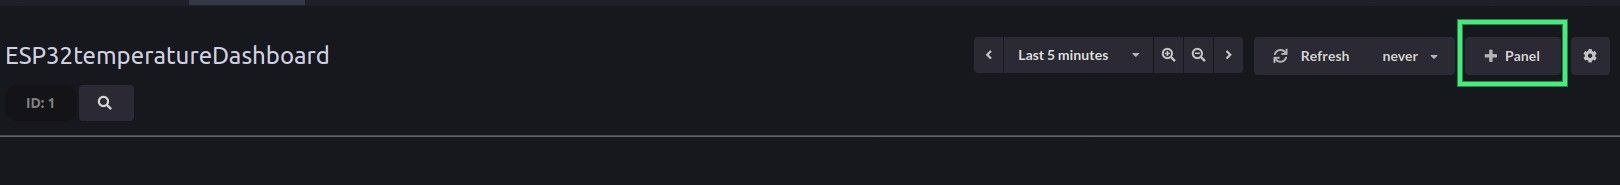
- Now Navigate to the Dashboards tab. And click on the dashboard title.
- Click on the Panel button to add visualizations.
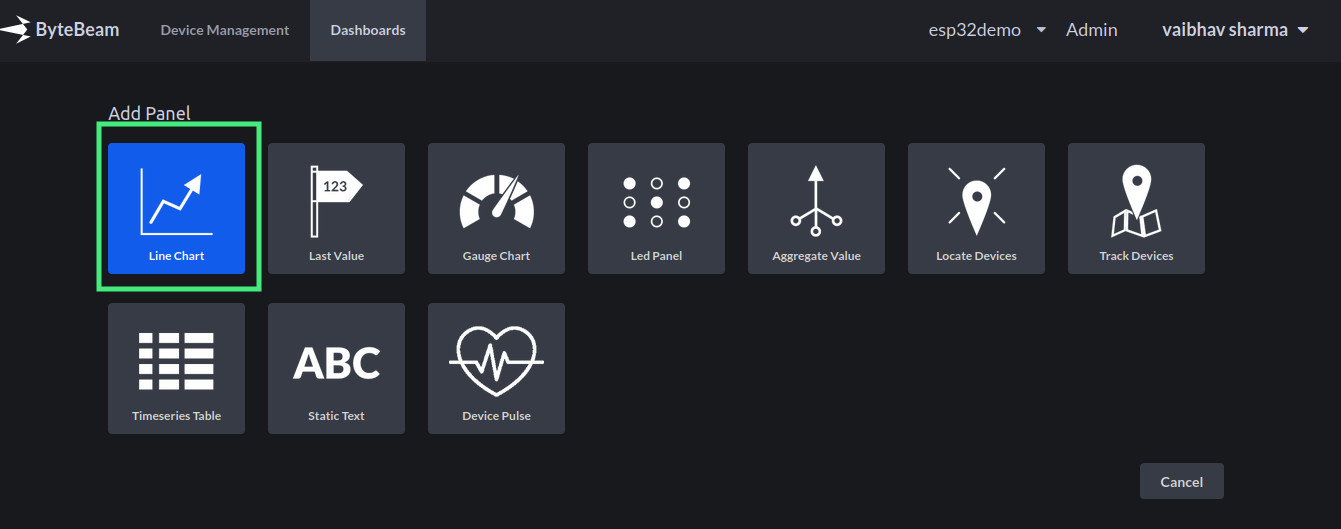
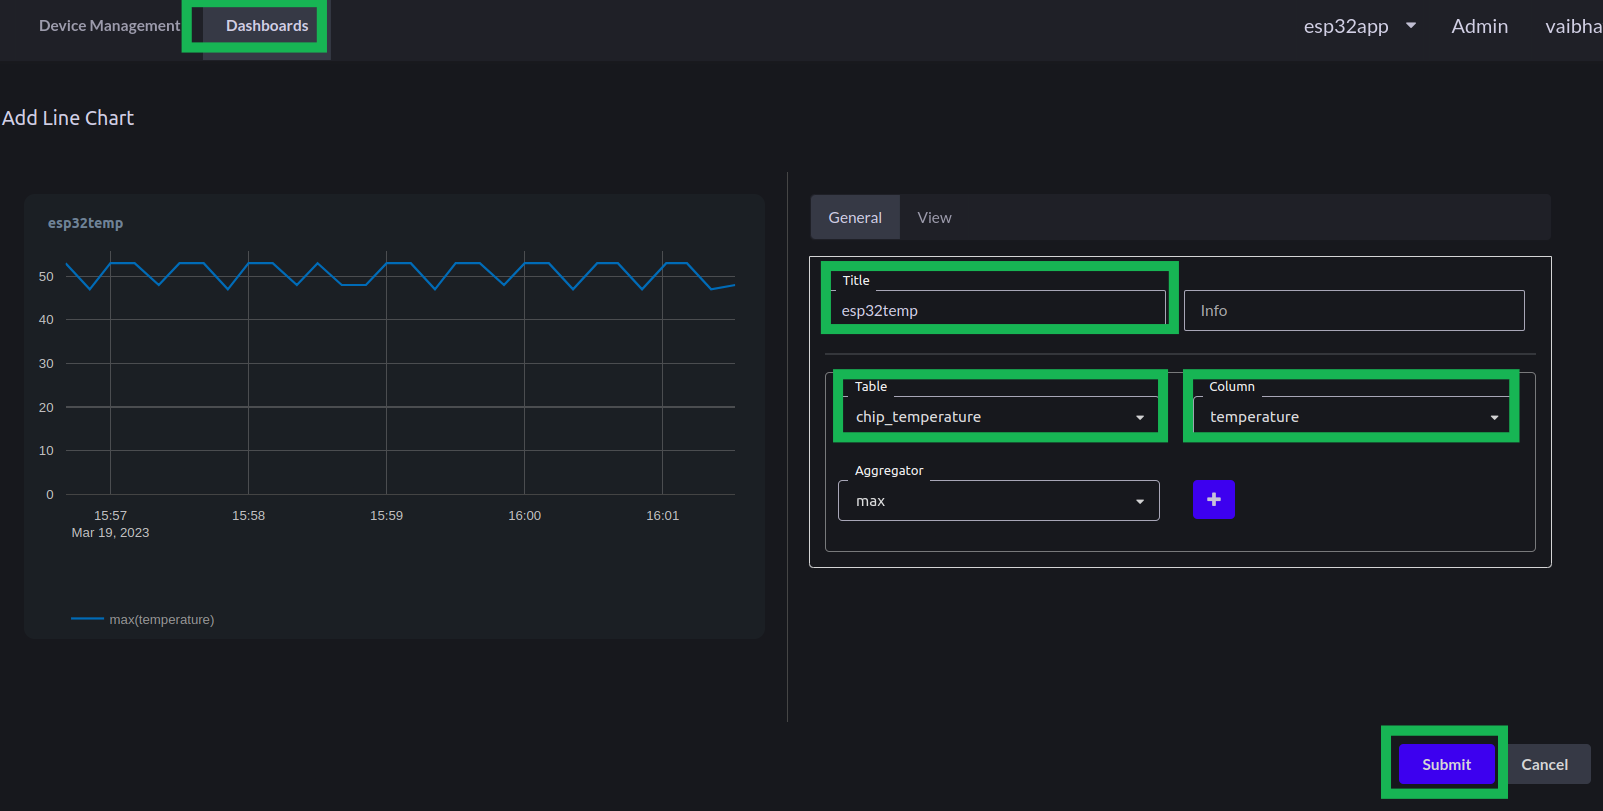
- Select from different panels available. Like we are choosing Line Chart.
- Give a name to your panel in the Title. select the table (device_shadow in our case) from the Table drop-down. select a column (temperature in our case) from the Column dropdown. and select max from the third drop-down. now your graph will look like this.
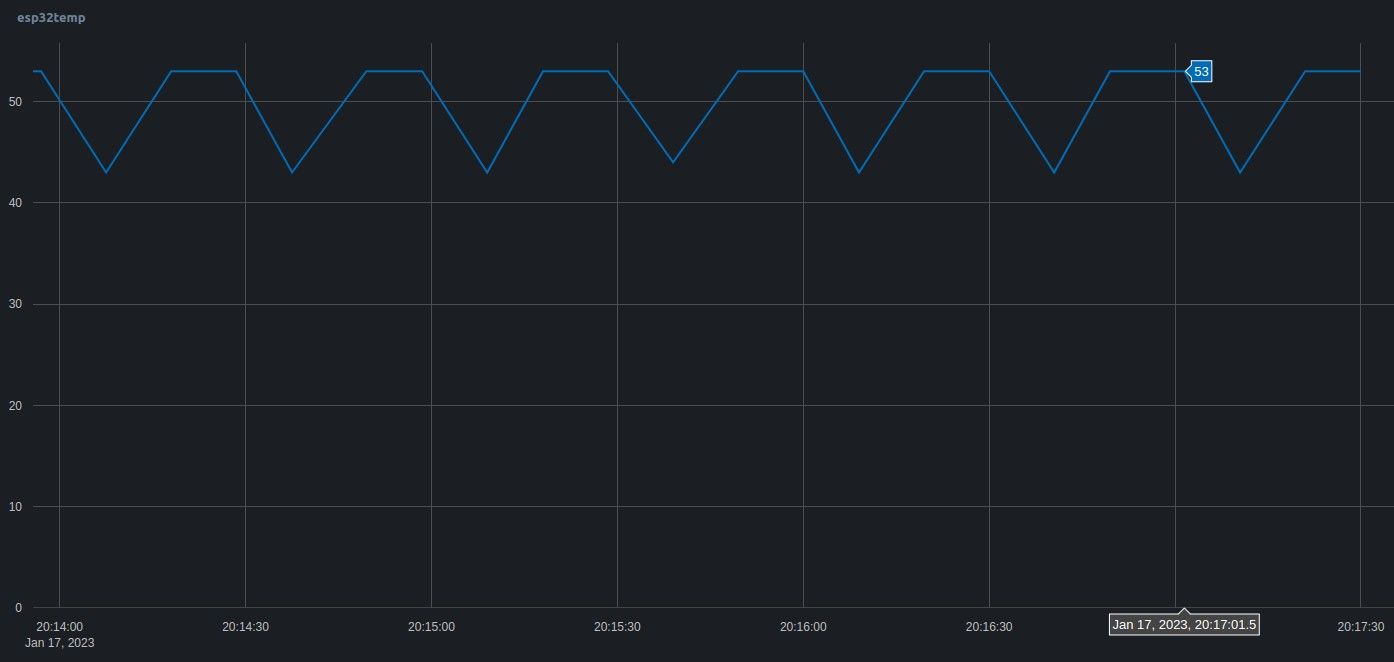
- Like this, you can create multiple visualizations at a user-defined refresh period for your dashboard. We are getting values every second from the device and we are updating the dashboard every 5s. So even sensitive information like touch can be plotted in a graph.
Conclusion
I hope you find this tutorial useful. We will come up with other interesting features offered by ByteBeam like OTA, remote debugging, actions and notifications, and more. In Part 2 of this multi-part series, we will be exploring the remote OTA option provided by ByteBeam. Stay in touch to get information on many other interesting IoT projects.


